From the Graph · July 22, 2026
The State of Enterprise AI Adoption: What 7.5 Million Companies Actually Show
Adoption is up everywhere. Value is not. What the Global Labor Graph reveals about the gap between deployment and return.
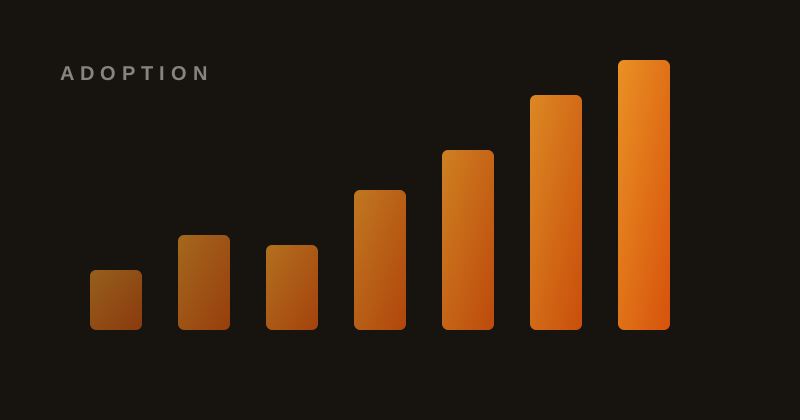
Every vendor deck says the same thing: adoption is accelerating. And it’s true — across the 7.5 million companies in the Global Labor Graph, AI deployment signals have climbed every quarter for three years.
Here’s what the decks don’t show: the value curve isn’t following the adoption curve.
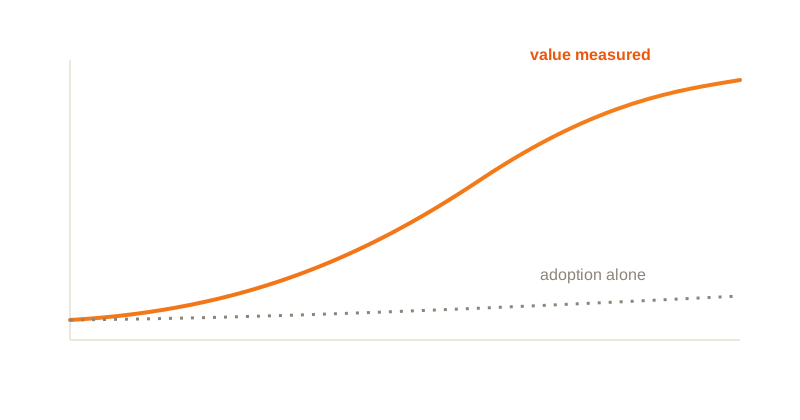
MIT found that 95% of generative-AI pilots produce no measurable financial return. S&P Global counted 42% of companies scrapping most of their AI initiatives in 2025. Our own data tells the same story from a different angle: when we compare deployment signals against workforce and financial outcomes, most adoption never converts.
Where the conversion happens
The pattern in the Graph is consistent across industries. Adoption converts to value under three conditions:
- The work was redesigned, not just accelerated. Time saved that flows into more meetings and more email is what researchers call organizational dark matter — it exists, but nobody can capture it.
- Readiness was measured before capital moved. Organizations that scored their ability to absorb a change before funding it show dramatically higher realization rates.
- Somebody kept score afterward. Deployments with continuous measurement get corrected. Deployments without it get quietly abandoned.
The sector picture
Financial services and legal lead on conversion — not because their tools are better, but because their work is measurable. Manufacturing adopts more slowly and realizes more reliably. Retail adopts fastest and abandons fastest.
The lesson isn’t “adopt less.” It’s that adoption was never the metric that mattered. The enterprises pulling ahead aren’t the ones deploying the most AI — they’re the ones who can tell you, with a number, what each deployment was worth.
That’s the question the Graph was built to answer.